What are Financial Metrics and How Are They Measured
Financial metrics are key performance indicators (KPIs) that organizations use to track and assess their financial performance. The most common financial metrics include measures of profitability, liquidity, solvency, and efficiency.
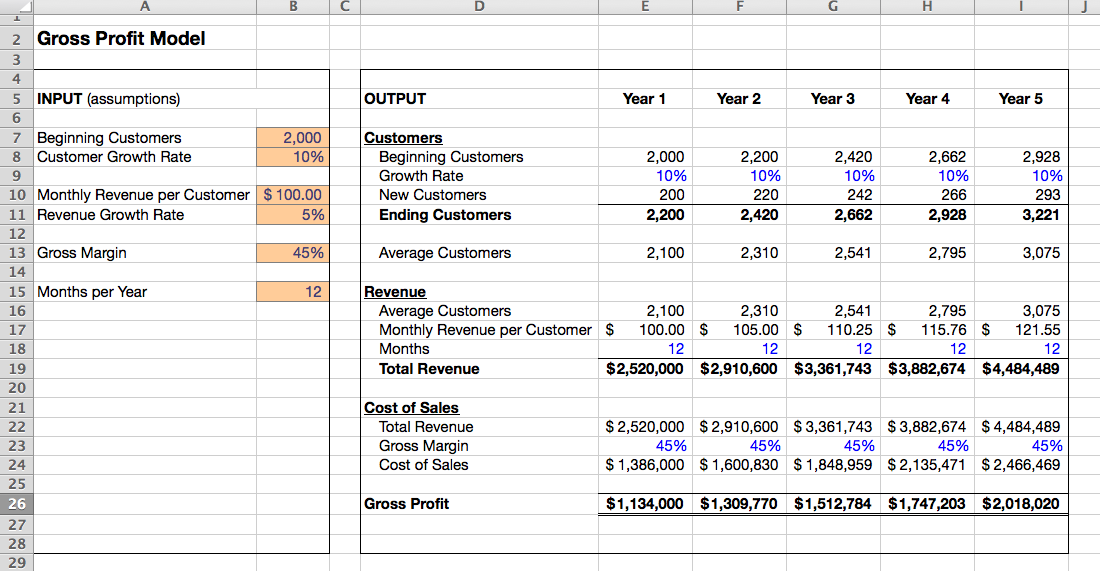
- Profitability measures assess an organization's ability to generate income and profits. The most common profitability metric is net income, which measures the total revenues less the total expenses for a period. Other profitability metrics include gross profit margin, operating profit margin, and return on assets (ROA).
- Liquidity measures assess an organization's ability to meet its short-term obligations. The most common liquidity metric is the current ratio, which measures the ratio of current assets to current liabilities. Other liquidity measures include the quick ratio and the cash ratio.
- Solvency measures assess an organization's ability to meet its long-term obligations. The most common solvency metric is debt to equity, which measures the ratio of total debt to total equity. Other solvency measures include interest coverage and free cash flow.
- Efficiency measures assess an organization's ability to use its resources effectively. The most common efficiency metric is inventory turnover, which measures the number of times inventory is sold and replaced over a period. Other efficiency measures include accounts receivable turnover and accounts payable turnover.
The top 10 financial metrics are (mainly for a Publicly traded company):
- Net income
- Gross profit margin
- Operating profit margin
- Return on assets (RoA)
- Current ratio
- Quick ratio
- Cash ratio
- Debt to equity
- Interest coverage
- Free cash flow (FCF)
Applying some these to Google (2019 Financial Report):
Publicly traded companies, compared to startups or small businesses can use different financial metrics to measure the financial strength of the company. Here is an example of Google and what financial metrics, analysts may consider in their valuations (based on Q1 2019 Report).
- Revenue: This is the total amount of money generated by a company in a given period of time. For Google, revenue was $39.3 billion in the first quarter of 2019.
- Net Income: This is the total profit of a company after taxes and other expenses are deducted from revenue. For Google, net income was $9.4 billion in the first quarter of 2019.
- Earnings per Share (EPS): This is the amount of net income earned per share of stock. For Google, EPS was $13.87 in the first quarter of 2019.
- Price to Earnings Ratio (P/E Ratio): This is a measure of how much investors are willing to pay for each dollar of a company’s earnings. For Google, the P/E ratio was 29.63 as of May 8, 2019.
- Return on Equity (ROE): This measures the profitability of a company in relation to the equity that shareholders have invested. For Google, ROE was 16.94% in the first quarter of 2019.
- Debt to Equity Ratio: This measures the amount of debt a company has in relation to the equity that shareholders have invested. For Google, the debt to equity ratio was 0.02 as of March 31, 2019.
- Cash Flow: This is the total amount of cash generated by a company in a given period of time. For Google, cash flow was $12.4 billion in the first quarter of 2019.
- Operating Margin: This measures the profitability of a company’s core operations. For Google, the operating margin was 26.2% in the first quarter of 2019.
- Net Margin: This measures the profitability of a company after taxes and other expenses are deducted from revenue. For Google, the net margin was 23.8% in the first quarter of 2019.
- Market Capitalization: This is the total value of a company’s shares of stock. For Google, market capitalization was $917.7 billion as of May 8, 2019.
Now, as these metrics are lagging and a snapshot in time, its pertinent to utilize the right financial metrics based on the stage of the firm in its lifecycle. It should also be noted that many metrics in Google example can be calculated easily as this information is made public. In case of startups and small business or private large firms, the due diligence is not as easy to do.

0 Comments